


U.S. Markets Mostly Up in March
Most stock markets in the U.S. and around most of the world advanced in March, in very stark contrast to February, when almost all equity indices around the world declined markedly.
There were a few days in mid-March that Wall Street and Main Street were really worried when the collapse of Silicon Valley Bank – the largest bank failure since 2008 – was announced. But investors mostly shook off the resulting spike in volatility after the Federal Reserve, the FDIC and the Treasury Department jointly acted to soothe markets.
Consistent with U.S. markets, performance in developed markets outside the U.S. was good too – as 36 of the 38 developed markets tracked by MSCI were positive, with most gaining between 2-3%. Performance in the emerging markets tracked by MSCI was more mixed, however, with 35 of those 46 indices advancing in March.
For the month of March:
- The DJIA gained 1.9%;
- The S&P 500 advanced 3.5%;
- NASDAQ leapt 6.7%; and
- The Russell 2000 retreated 5.0%.
The themes that drove market performance in March continued to center around inflation, the Fed, and the labor market, as recent inflation numbers hinted at potential decline while labor market numbers suggested that the Fed could continue its pace of rate hikes further into the year.
Volatility, as measured by the VIX, decreased in March, beginning the month just above 20 and ending the month just below 19, although there were a few significant spikes in the middle of the month.
West Texas Intermediate crude also declined this month, starting March at $77.69/barrel and ending the month at $75.67. But the middle of March saw the price dip below $67/barrel before rising steadily the remainder of the month.
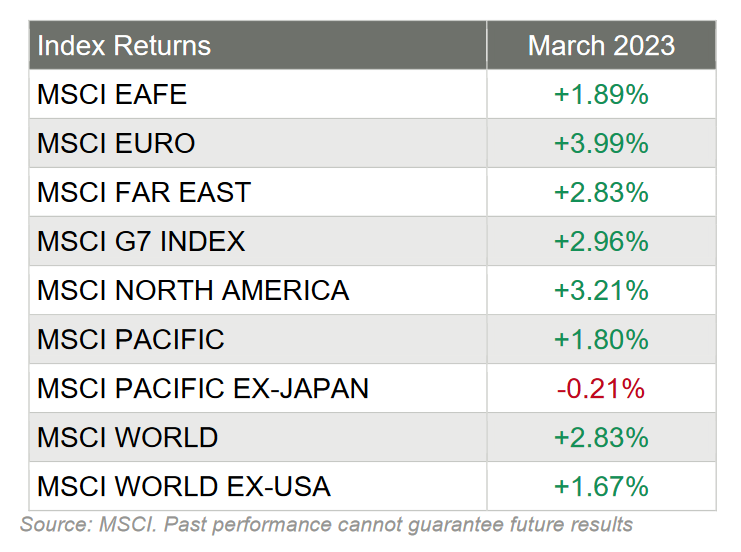
Market Performance Around the World
Investors looking outside the U.S. saw good performance too, as 36 of the 38 developed markets tracked by MSCI advanced this month – with the vast majority (32 of the 38) gaining between 1% – 3%.
Performance for emerging markets was much more mixed, with 35 of the 46 indices positive for the month, with 11 of those 35 gaining more than 3%.
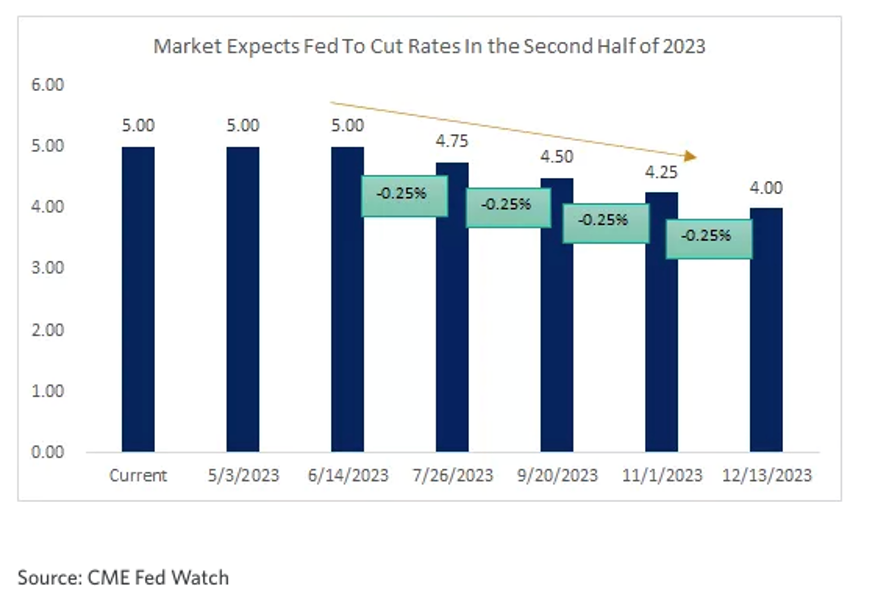
The Fed Raises Rates Again
One of the most talked about event this month was the Federal Reserve’s policy meeting and as expected, the Fed raised official short-term rates by 25 basis points in late March. Further, the “dot plot” pointed to hopes that the Fed might stop raising rates after one final on in May. Most interesting is that the fed funds futures markets ended the week pricing in a 98.2% chance that rates would end the year lower – with a whopping 95% chance that cuts would start this summer.
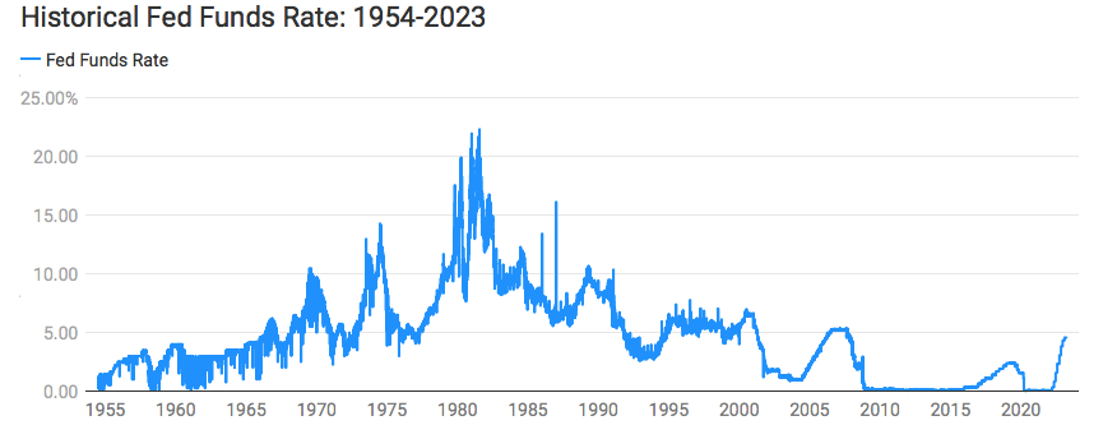
For perspective, it was almost exactly one year ago, on March 16, 2022, that the Federal Open Market Committee enacted the first of what would become nine consecutive interest rate increases.
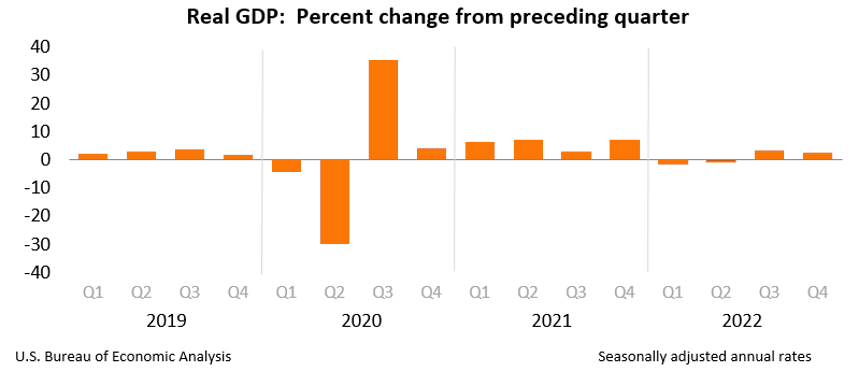
GDP Up 2.6% in 4th Quarter
As the month came to a close, the Bureau of Economic Analysis reported that real gross domestic product increased at an annual rate of 2.6% in the fourth quarter of 2022. For perspective, in the third quarter, real GDP increased 3.2%.
This is the “third” GDP estimate released and it is based on more complete source data than were available for the "second" estimate issued last month. In the second estimate, the increase in real GDP was 2.7%. The revision primarily reflected downward revisions to exports and consumer spending. Imports, which are a subtraction in the calculation of GDP, were revised down.
“The increase in real GDP primarily reflected increases in private inventory investment, consumer spending, nonresidential fixed investment, federal government spending, and state and local government spending that were partly offset by decreases in residential fixed investment and exports. Imports decreased.
The increase in private inventory investment was led by manufacturing (mainly petroleum and coal products) as well as mining, utilities, and construction (led by utilities). The increase in consumer spending reflected an increase in services that was partly offset by a decrease in goods. Within services, the increase was led by health care as well as housing and utilities. Within goods, the leading contributor to the decrease was "other" durable goods (mainly jewelry). Within nonresidential fixed investment, increases in structures and intellectual property products (mainly software) were partly offset by a decrease in equipment. The increase in federal government spending was led by nondefense spending. The increase in state and local government spending primarily reflected an increase in the compensation of state and local government employees.
Within residential fixed investment, the leading contributors to the decrease were new single-family construction and brokers' commissions. Within exports, a decrease in goods (led by nondurable goods excluding petroleum) was partly offset by an increase in services (led by travel as well as transport). Within imports, both goods (led by durable consumer goods) and services (led by transport) decreased.”
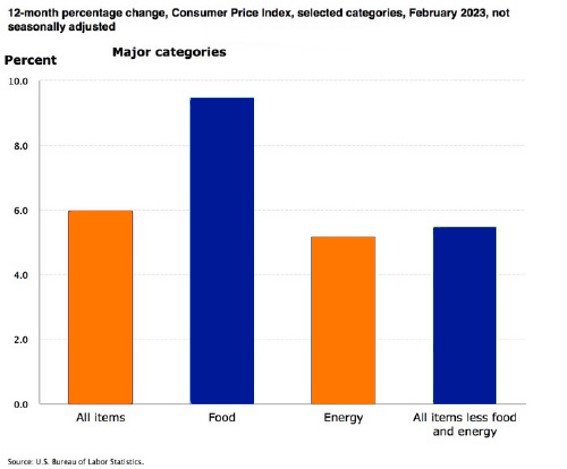
Consumer Price Index Records Smaller Increase, But Food Index is Up 9.5% Over the Last Year
The U.S. Bureau of Labor Statistics reported that the Consumer Price Index for All Urban Consumers rose 0.4% in February, after increasing 0.5% in January. Over the last 12 months, all items index increased 6.0% before seasonal adjustment.
Specifically:
- The index for shelter was the largest contributor to the monthly all items increase, accounting for over 70% of the increase, with the indexes for food, recreation, and household furnishings and operations also contributing.
- The food index increased 0.4% over the month with the food at home index rising 0.3%.
- The energy index decreased 0.6% over the month as the natural gas and fuel oil indexes both declined.
- Categories which increased in February include shelter, recreation, household furnishings and operations, and airline fares.
- The index for used cars and trucks and the index for medical care were among those that decreased over the month.
Inflation Over the Past 12-Month
The all items index increased 6.0% for the 12 months ending February; this was the smallest 12-month increase since the period ending September 2021.
- The all items less food and energy index rose 5.5% over the last 12 months, its smallest 12-month increase since December 2021.
- The energy index increased 5.2% for the 12 months ending February.
- The food index increased 9.5% over the last year.
Food Index
- The food index increased 0.4% in February, and the food at home index rose 0.3% over the month. Five of the six major grocery store food group indexes increased over the month. The index for nonalcoholic beverages increased 1.0% in February, after a 0.4% increase the previous month. The indexes for other food at home and for cereals and bakery products each rose 0.3% over the month. The index for fruits and vegetables increased 0.2% in February, and the index for dairy and related products rose 0.1%.
- In contrast, the meats, poultry, fish, and eggs index fell 0.1 percent over the month, the first decrease in that index since December 2021. The index for eggs fell 6.7% in February following sharp increases in recent months.
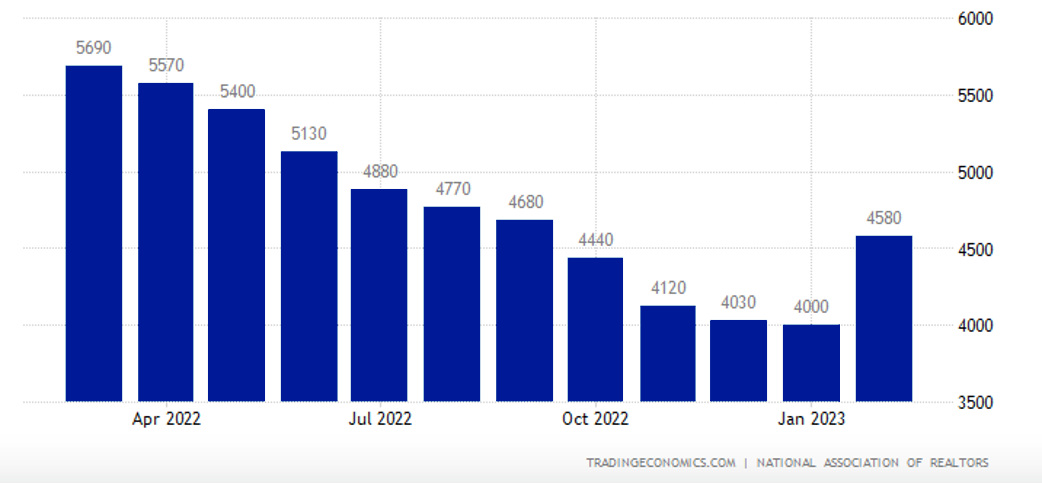
Existing Home Sales Jump Home Prices Slide for the First Time in 11 Years
The National Association of Realtors reported that “existing-home sales reversed a 12-month slide in February, registering the largest monthly percentage increase since July 2020. Month-over-month sales rose in all four major U.S. regions. All regions posted year-over-year declines.
- Total existing-home sales completed transactions that include single-family homes, townhomes, condominiums and co-ops – vaulted 14.5% from January to a seasonally adjusted annual rate of 4.58 million in February.
- Year-over-year, sales fell 22.6% (down from 5.92 million in February 2022).
- Total housing inventory registered at the end of February was 980,000 units, identical to January and up 15.3% from one year ago (850,000).
- Unsold inventory sits at a 2.6-month supply at the current sales pace, down 10.3% from January but up from 1.7 months in February 2022.”
Existing Home Sales
Median Prices Slide After 131 Months of Gains
- “The median existing-home price for all housing types in January was $363,000, a decline of 0.2% from February 2022 ($363,700), as prices climbed in the Midwest and South yet waned in the Northeast and West.
- This ends a streak of 131 consecutive months of year-over-year increases, the longest on record.
- Properties typically remained on the market for 34 days in February, up from 33 days in January and 18 days in February 2022.
- Fifty-seven percent of homes sold in February were on the market for less than a month.
- First-time buyers were responsible for 27% of sales in February, down from 31% in January and 29% in February 2022.
- All-cash sales accounted for 28% of transactions in February, down from 29% in January but up from 25% in February 2022.
- Distressed sales – foreclosures and short sales – represented 2% of sales in February, nearly identical to last month and one year ago.
Regional Breakdown
- Existing-home sales in the Northeast improved 4.0%, down 25.7% from February 2022. The median price in the Northeast was $366,100, down 4.5% from the previous year.
- In the Midwest, existing-home sales grew 13.5%, declining 18.7% from one year ago. The median price in the Midwest was $261,200, up 5.0% from February 2022.
- Existing-home sales in the South rebounded 15.9% in February, a 21.3% decrease from the prior year. The median price in the South was $342,000, an increase of 2.7% from one year ago.
- In the West, existing-home sales rocketed 19.4% in February, down 28.3% from the previous year. The median price in the West was $541,100, down 5.6% from February 2022.”
Durable Goods Orders Drop Again in February
The U.S. Census Bureau announces the February advance report on durable goods manufacturers’ shipments, inventories and orders:
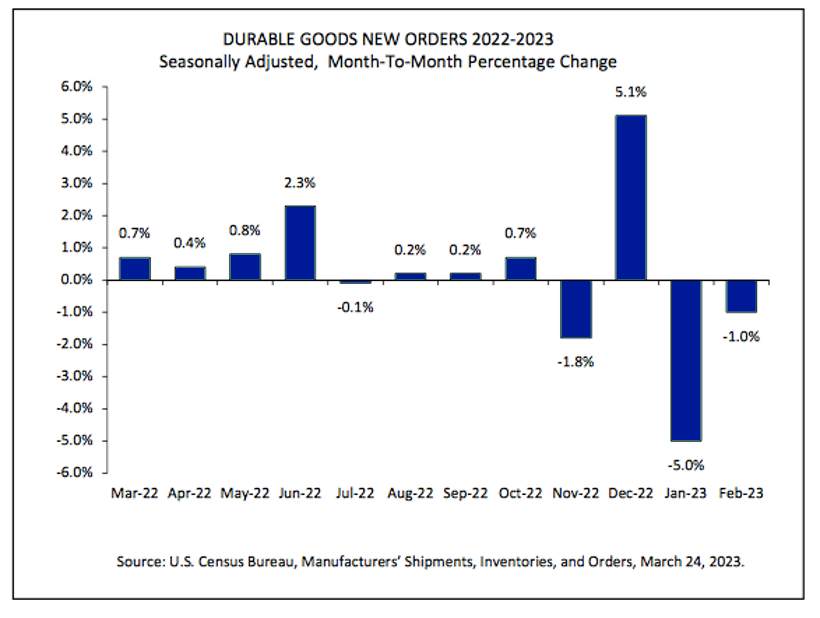
New Orders
- New orders for manufactured durable goods in February, down three of the last four months, decreased $2.6 billion or 1.0% to $268.4 billion
- This followed a 5.0% January decrease.
- Excluding transportation, new orders were virtually unchanged.
- Excluding defense, new orders decreased 0.5%.
- Transportation equipment, also down three of the last four months, drove the decrease, $2.6 billion or 2.8% to $89.4 billion.
Shipments
- Shipments of manufactured durable goods in February, down two consecutive months, decreased $1.5 billion or 0.6% to $274.8 billion.
- This followed a 0.4% January decrease.
- Transportation equipment, also down two consecutive months, led the decrease, $1.3 billion or 1.4% to $90.1 billion.
Unfilled Orders
- Unfilled orders for manufactured durable goods in February, down two consecutive months, decreased $1.2 billion or 0.1% to $1,155.4 billion.
- This followed a virtually unchanged January decrease.
- Transportation equipment, down following twenty-one consecutive monthly increases, led the decrease, $0.7 billion or 0.1% to $683.8 billion.
Inventories
- Inventories of manufactured durable goods in February, up twenty-four of the last twenty-five months, increased $0.9 billion or 0.2% to $493.6 billion.
- This followed a 0.2% January decrease.
- Transportation equipment, up three of the last four months, led the increase, $0.6 billion or 0.4% to $158.8 billion.
Capital Goods
- Nondefense new orders for capital goods in February decreased $1.0 billion or 1.2% to $82.0 billion.
- Shipments decreased $0.5 billion or 0.6% to $83.2 billion.
- Unfilled orders decreased $1.2 billion or 0.2% to $662.6 billion.
- Inventories increased $0.5 billion or 0.2% to $218.8 billion.
- Defense new orders for capital goods in February decreased $1.2 billion or 7.4% to $14.5 billion.
- Shipments decreased $0.2 billion or 1.6% to $14.6 billion.
- Unfilled orders decreased $0.2 billion or 0.1% to $188.9 billion.
- Inventories increased $0.1 billion or 0.3% to $23.3 billion.
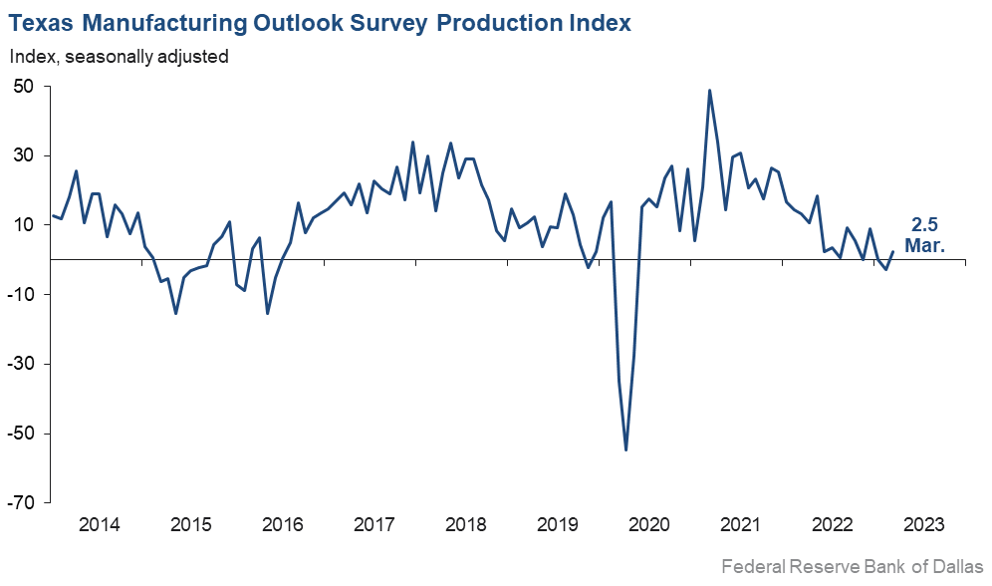
Modest Growth in Texas Manufacturing But Outlook Worsens
On Monday, the Dallas Fed reported that “Texas factory activity expanded slightly in March after contracting in February. The production index, a key measure of state manufacturing conditions, moved up from -2.8 to 2.5, a reading suggestive of a modest increase in output.
Further, other measures of manufacturing activity showed mixed signals this month, including:
- The new orders index was negative for a 10th month in a row and came in at -14.3, little changed from February.
- The growth rate of orders index was also negative and largely unchanged, at -15.2.
- The capacity utilization index returned to positive territory, moving up six points to 2.3.
- The shipments index pushed down from -5.0 to -10.5.
Sources: bea.gov; nar.realtor; census.gov; dol.gov; msci.com; fidelity.com; msci.com; nasdaq.com; wsj.com; morningstar.com